Contact: ganseymf@gmail.com
© Moray Firth Gansey Project June 2018
This project was part-


How to: Chart a design
Pattern grid
When you are designing a pattern it helps if you use a grid with boxes which are wider than they are tall as it gives a truer picture of what the knitted design will look like (a 10 cm / 4 inch tension square knitted in stocking stitch will normally have more rows than stitches).
You can use regular squared paper, but if you do you need to bear in mind that when knitted the design will look shorter and wider than it does on paper.
There are a number of internet sites which allow you to download knitters’ graph paper free of charge. This one enables you to create graph paper to your own gauge (i.e. stitches / rows per centimetre or inch): http://www.tata-
You can also create a grid using a computer spreadsheet programme, or a table in a word processing application. Using a programme specifically designed for creating knitting charts is even better as the symbols have already been created for you.
Chart conventions
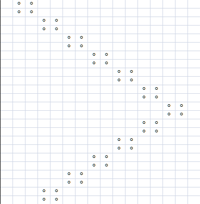
A gansey pattern chart is generally designed so that the knitter starts in the bottom right hand corner and works along the bottom row first, then works subsequent rounds or rows in sequence.
Notation
Stitches which appear as plain knit stitches on the right side of the garment are generally represented by blank boxes.
Purl stitches are shown by filled in boxes, often by: o, •, or x
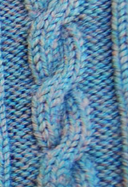
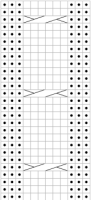
Cables can be shown by a hooked line: or, perhaps more usually, like this:
In this example the cable is worked over two stitches; the first stitch is put to the back of the work, the second stitch knitted, then the first.

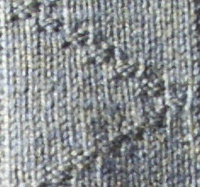
Examples of charted designs:

| Project outcomes |
| Contact us |
| The Moray Firth |
| Competition |
| Project outline |
| Exhibition gallery |
| Further Information |
| Gansey knitters gallery |
| Ganseys from other areas |
| Lewis |
| Pattern elements 1 |
| Pattern elements 2 |
| Pattern elements 3 |
| Small things to make |
| Beatrice Gansey |
| Read a chart |
| Chart a design |
| Portsoy 2012 |
| Wick Harbourfest 2012 |
| Ganseyfest 2011 |
| London Fashion Week |
| UK Knit Camp 2010 |
| Speyfest 2010 |
| Portsoy photos 2010 |
| Extravagansey photos 2010 |
| Nairn Museum |
| Gfest gallery |
| Gfest gallery 2 |